Settings Panel
The Settings Panel, which you can go to by clicking Settings on the top right corner,
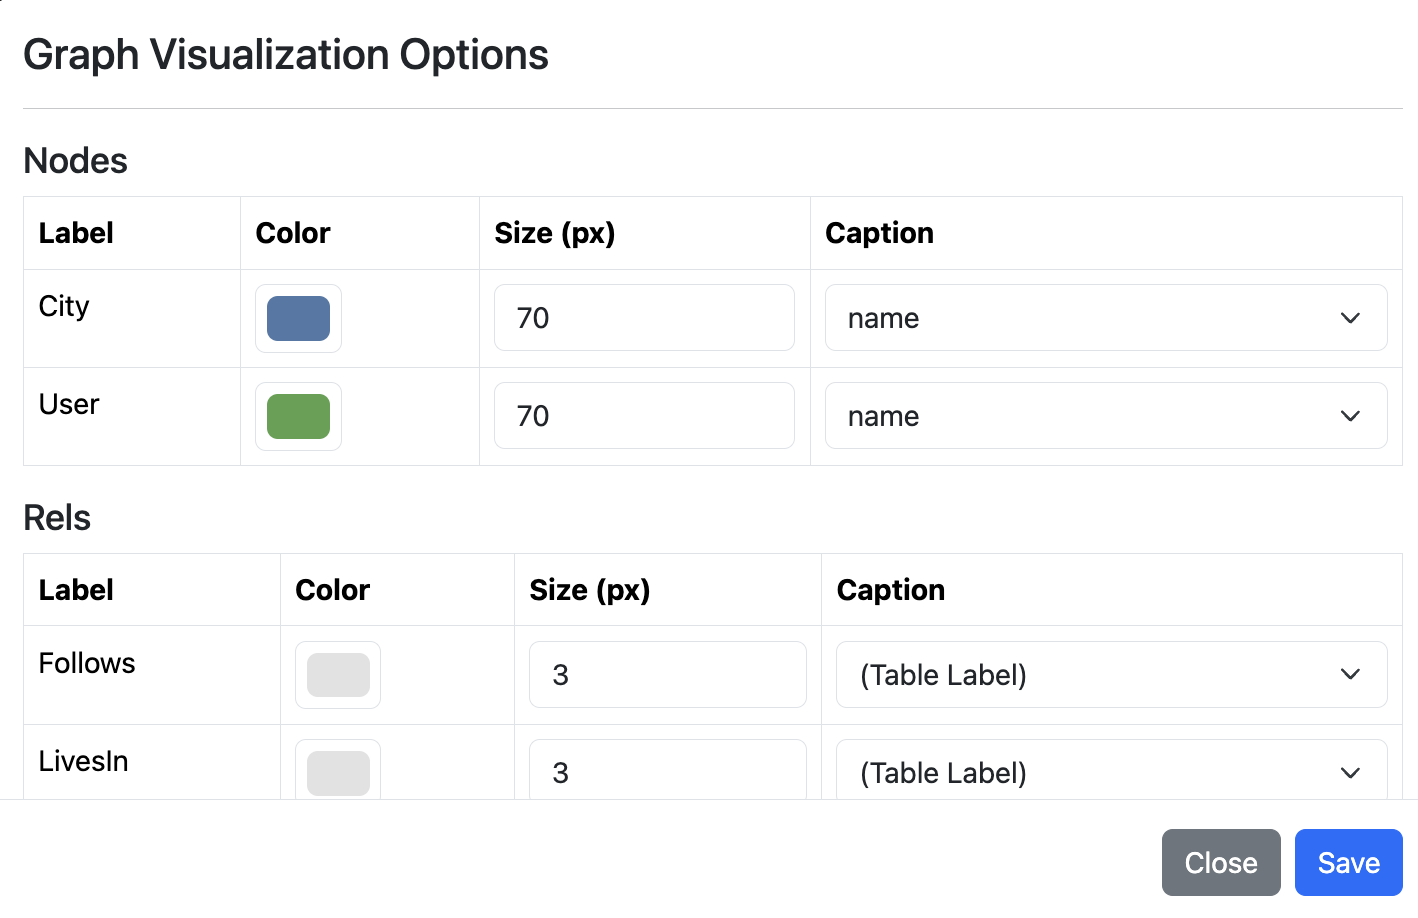
contains several knobs to configure your schema and query result visualizations. Below is
a screenshot of the Settings Panel.
The available configurations are:
- Changing the color, size, and captions of nodes and relationships in graph views: The size and caption configurations only change the rendering of the nodes and relationships in the query results and not the graph schema. For captions, you can choose to display a property, the table name of the nodes/relationships, or omit the caption completely. Changing the color of a node or relationship changes both the database schema visualization as well as query result visualization.
- Max number of nodes to draw when visualizing query results: If a query returns a very large number
of nodes, rendering it on the canvas can be very cumbersome and slow. To avoid this, there is a maximum limit of the
number of nodes and the edges between these nodes that are drawn.
Under the
Performance Optionsheading, this limit can be changed. - Option to write or omit the relationship table names: If your database schema is complex and contains many relationship
tables, it might be cumbersome to write relationship table names on every relationship. You can instead omit writing
relationship table names on the graph schema view and only show them when you hover or click on a relationship.
To do so, choose the
On hover or clickoption from the dropdown menu next toShow relationship labelsinstead of the defaultAlways. - Number of rows per page in table view: When you visualize query results as a table, if the table is large, we paginate the results. This option sets the number of rows per page.