Shell Panel
Using the Shell Panel, you can interactively issue queries to your loaded database and visualize the results in several different views. You issue queries by using the canvases on your screen, which have a red X and green play icon on the left side. You write your query on the top of a canvas and when you click the play button or press Shift+Enter, the query in the canvas is issued. Below is a screenshot that asks a simple query that returns all of the relationships and their source and destination nodes in the database. The results of the query can be rendered in 3 possible ways.
First, query results can be rendered as a graph view as shown below.
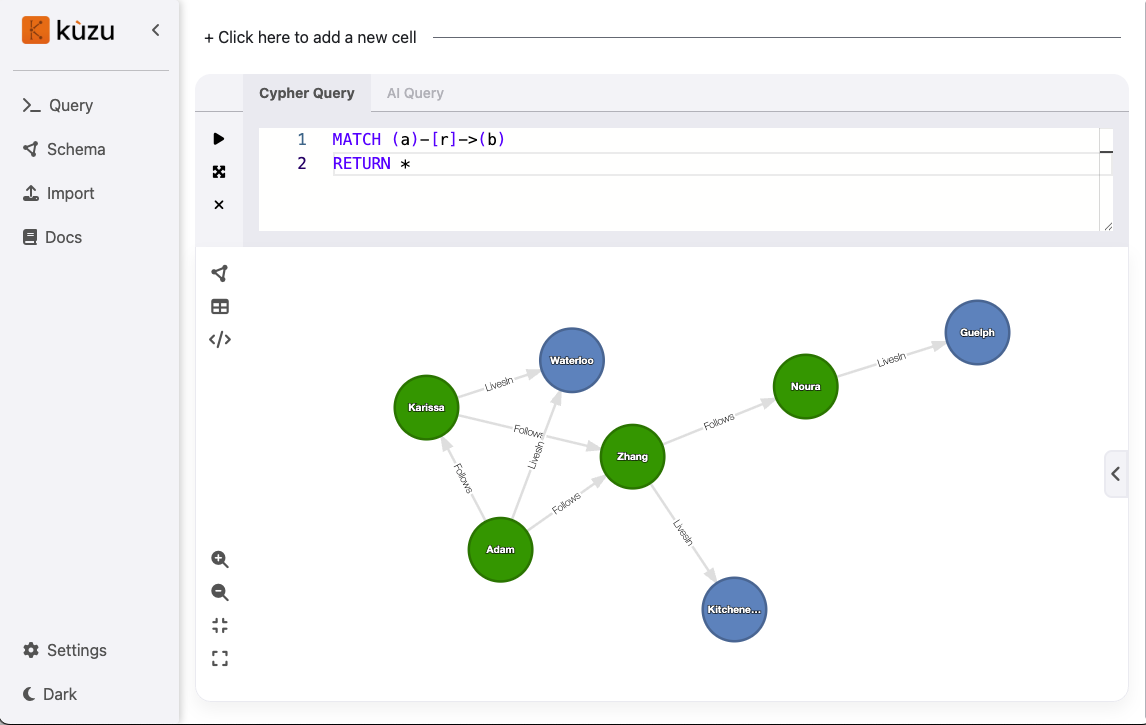
There is a side panel in the graph view, which you can open and close to see the properties of
individual nodes and relationships you click on or hover over. The graph view is enabled
and is the default view if the query’s RETURN statement contains node (and relationship) variables.
For example if the query about returned only the name property of a nodes, i.e.,
if the return statement was RETURN a.name, then you could not see the results in a graph view,
as the return values are only a column of strings. As long as one of the variables projected
in the RETURN statement is a node you will get by default a graph view.
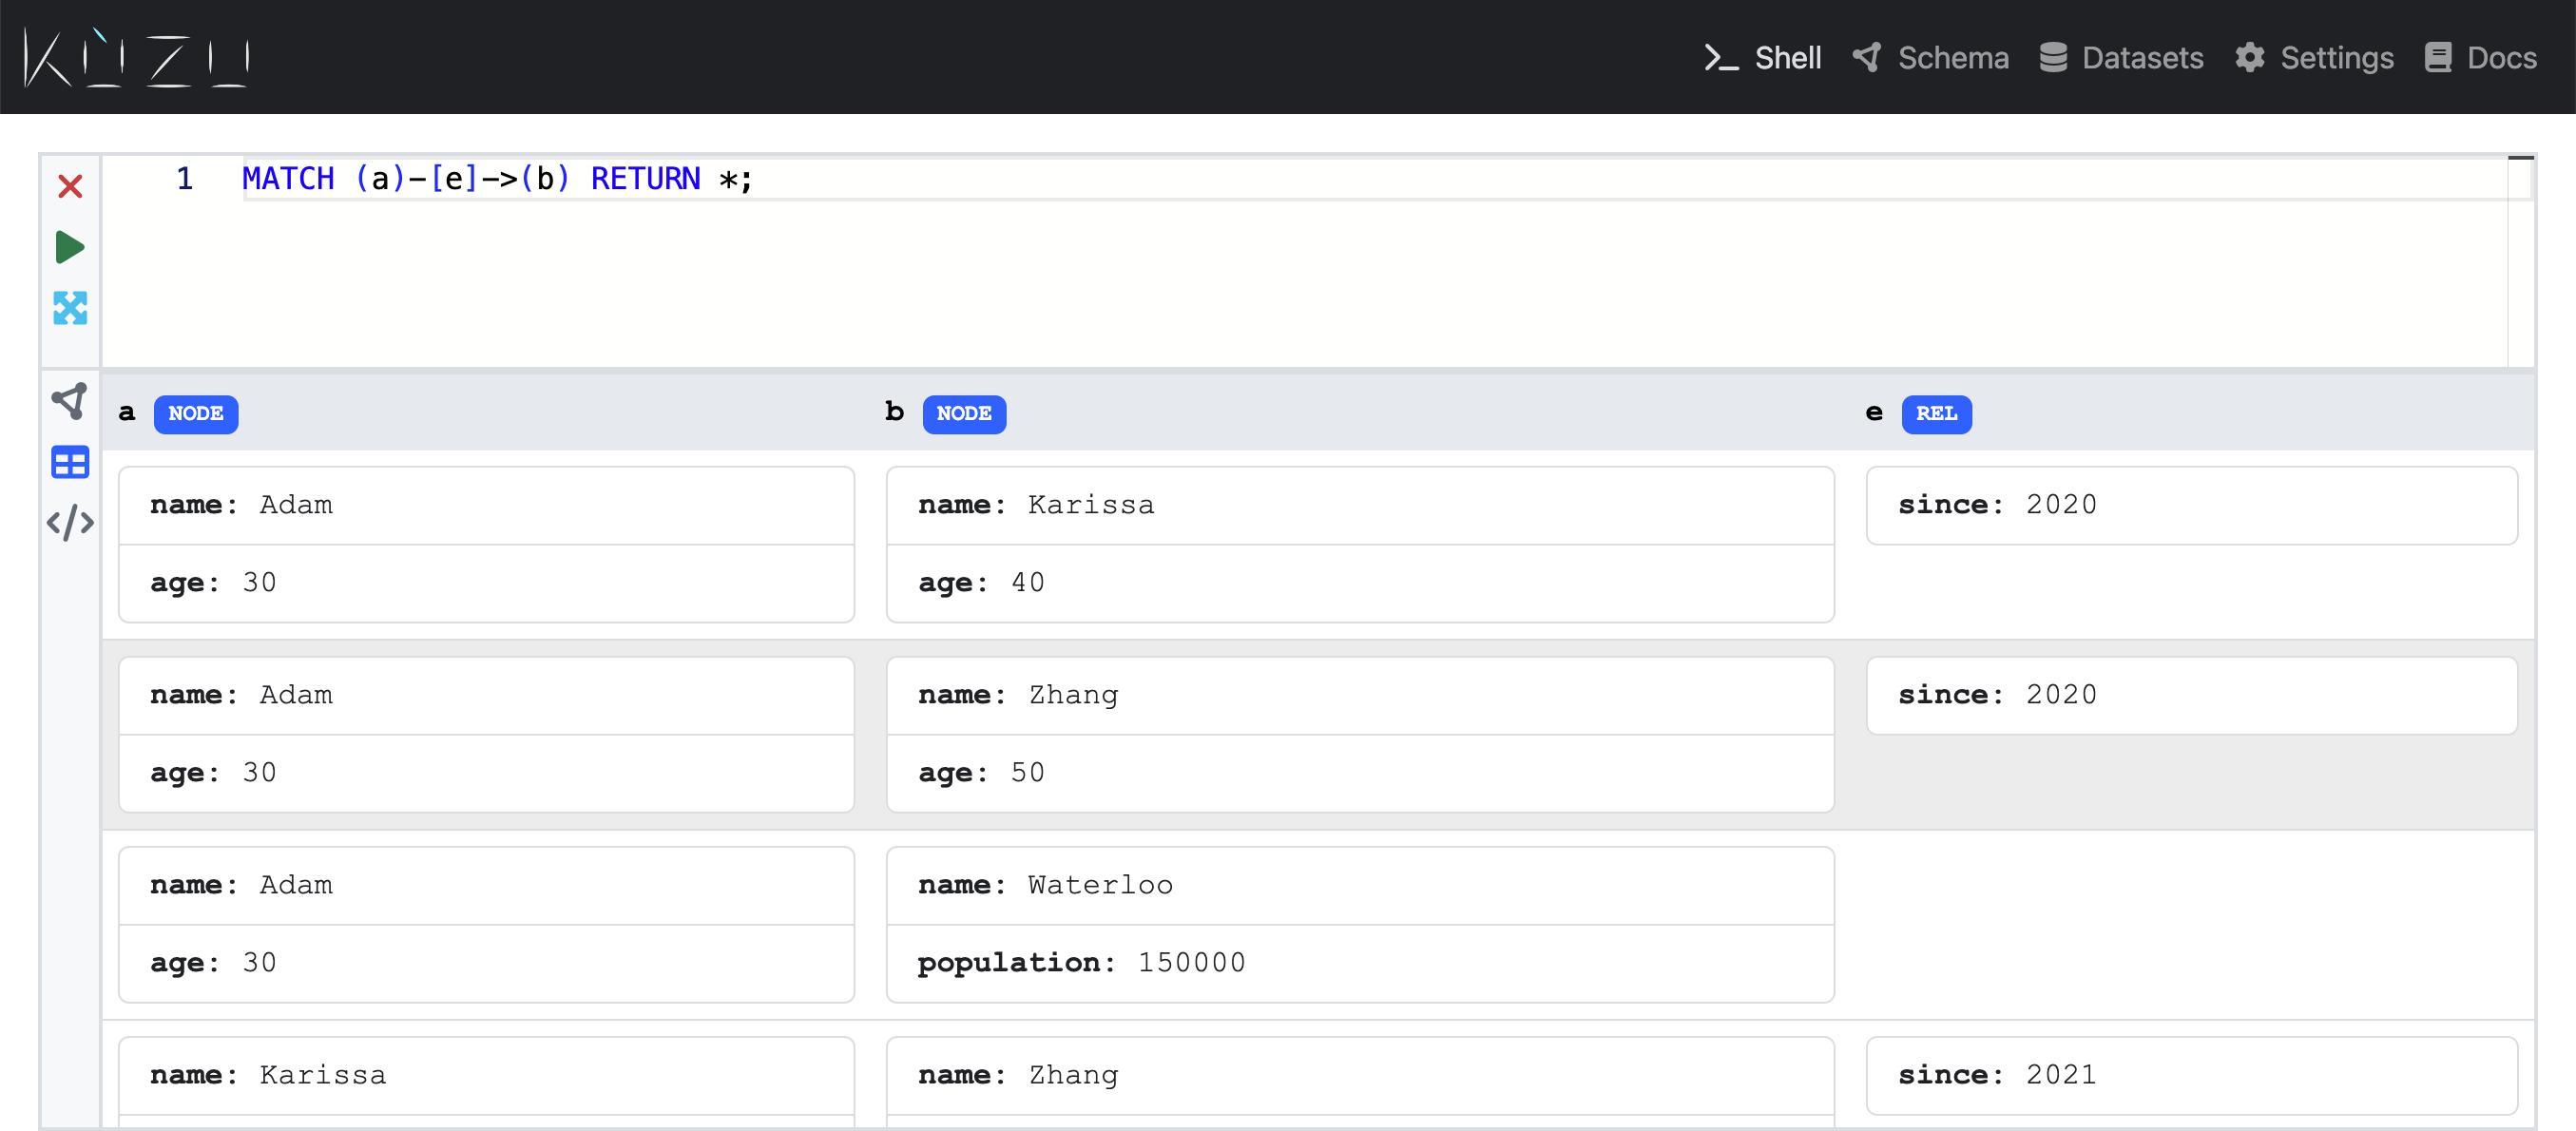
Second, query results can be output as a table as shown below by clicking the table icon on the left hand side of a canvas.
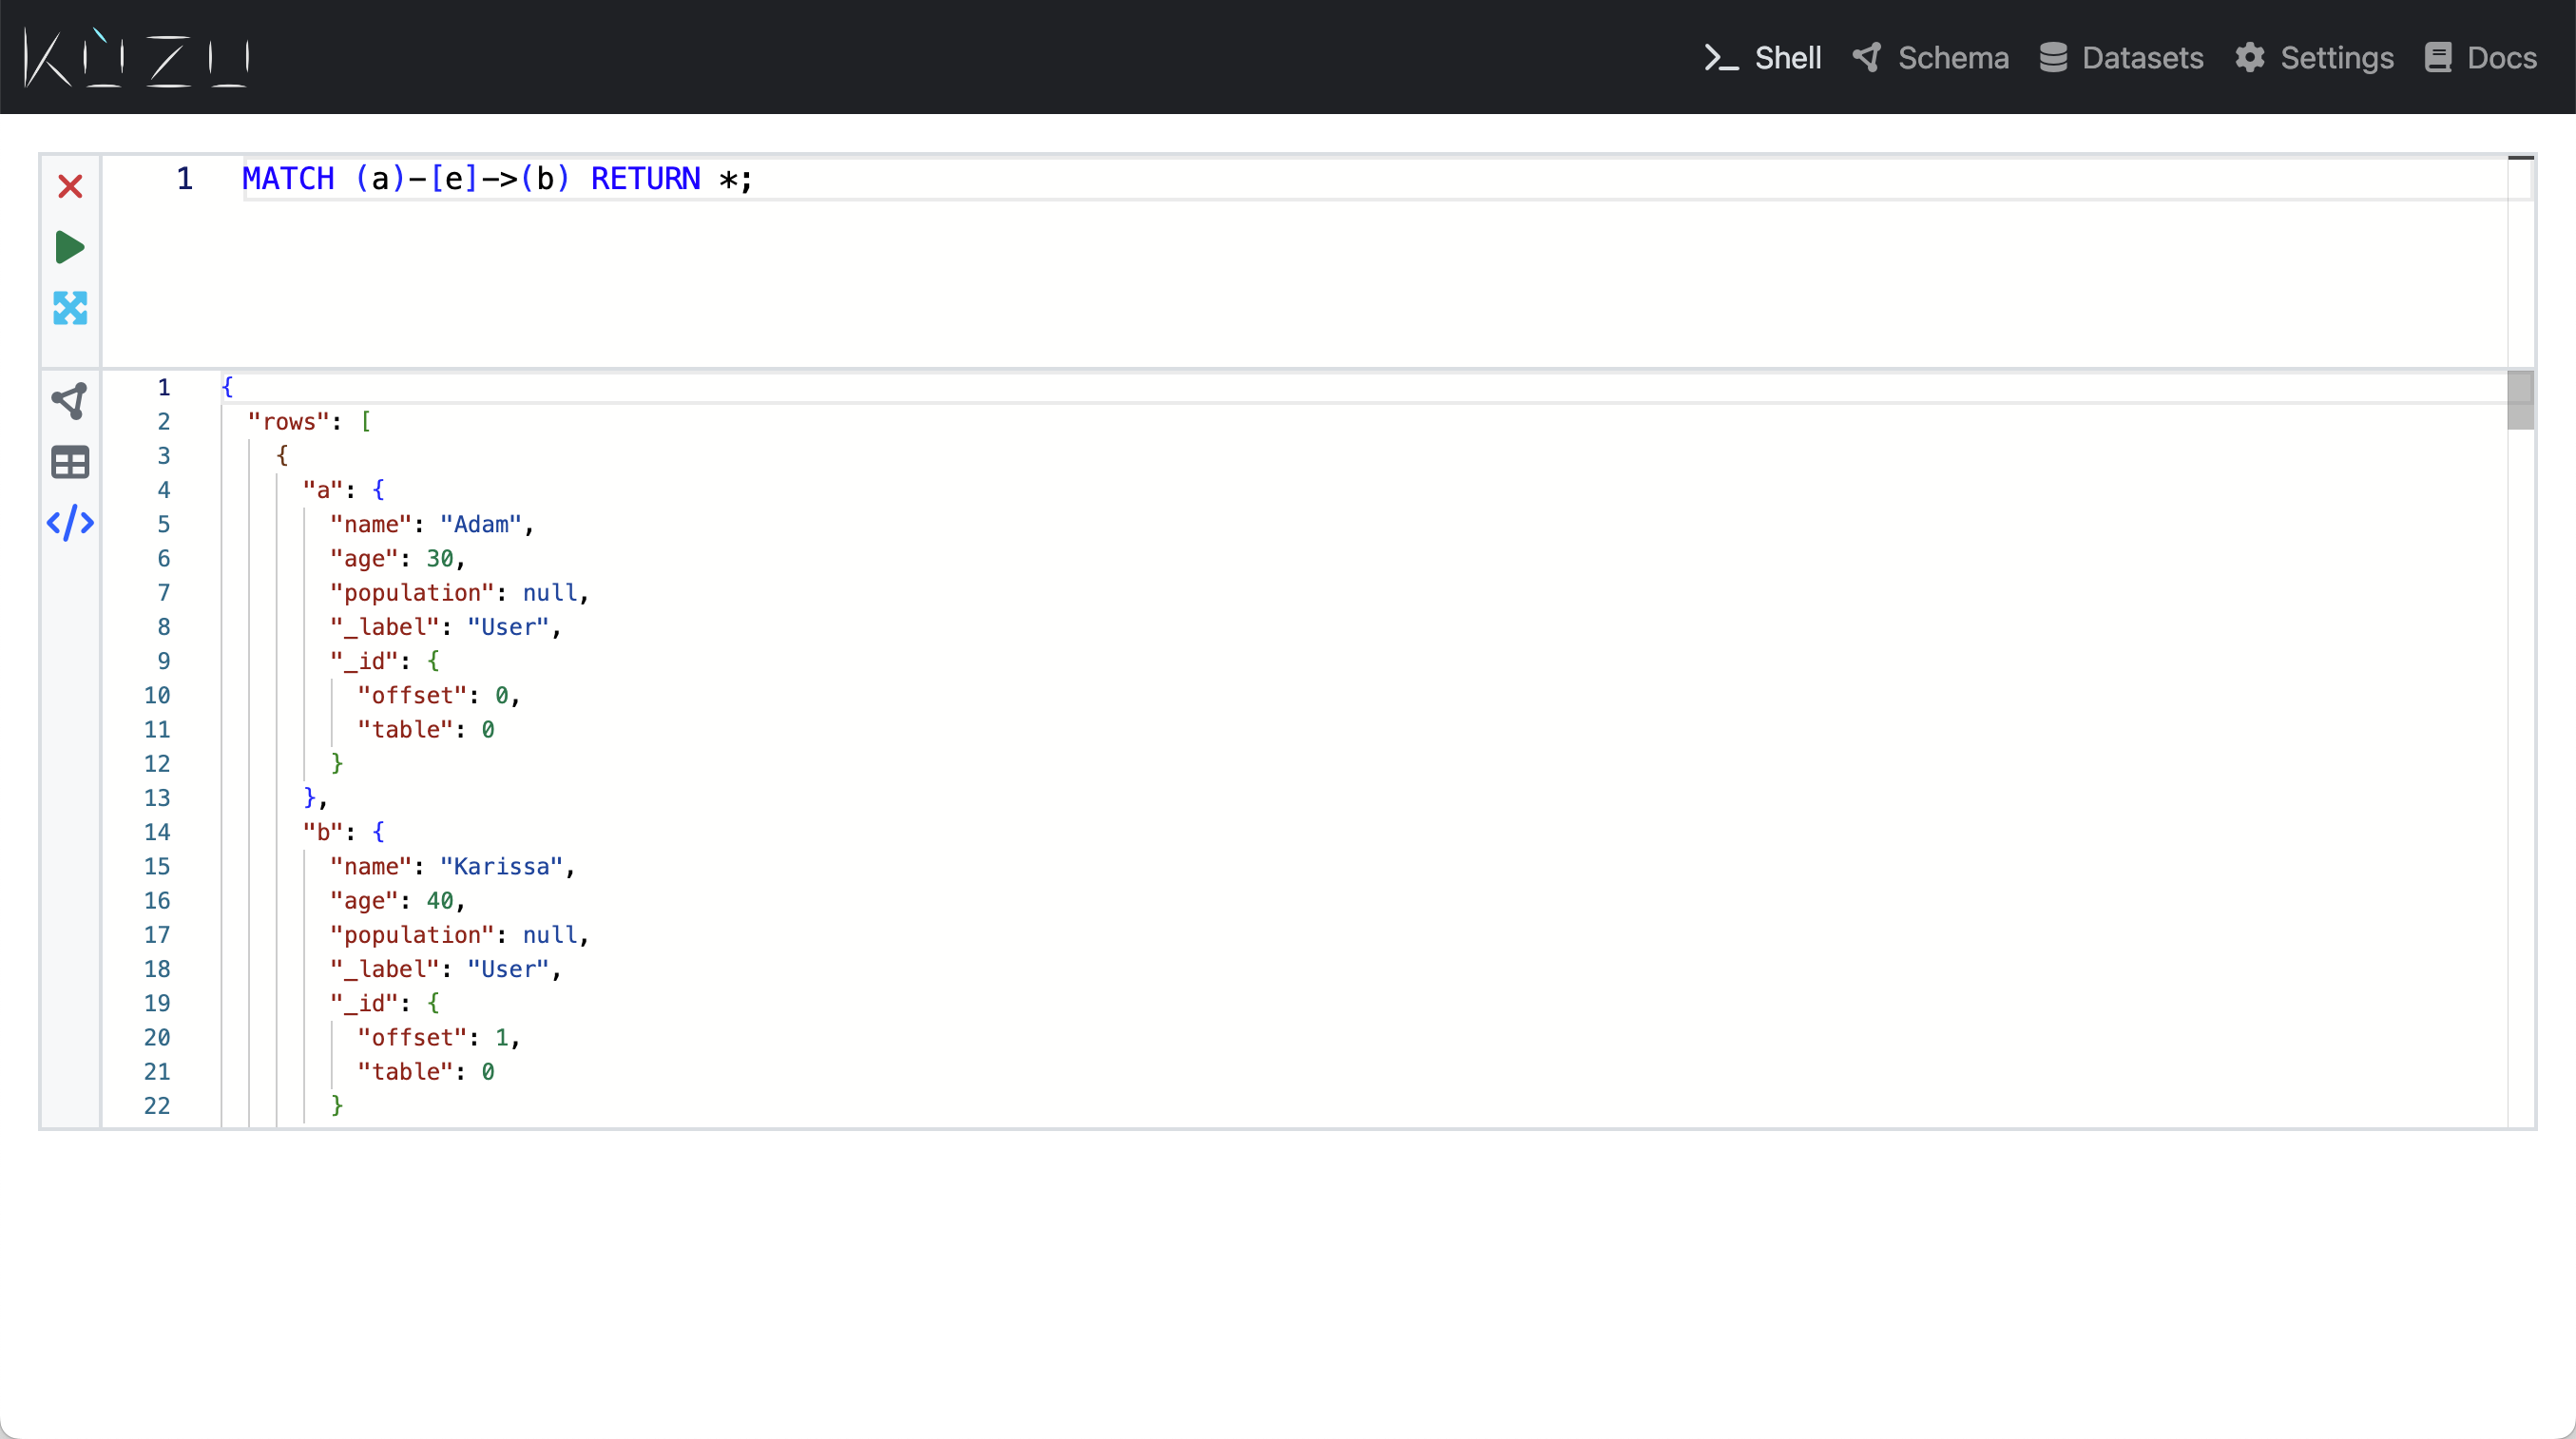
Finally query results can be output in JSON format as shown below by clicking the </> icon on the
left hand side of a canvas.