yFiles Jupyter Graphs for Kuzu
yFiles Jupyter Graphs for Kuzu is an open source Jupyter notebook widget that allows you to visualize Kuzu graphs from inside your Jupyter notebooks. It leverages the larger yFiles Jupyter Graphs ecosystem from yWorks.
When working interactively in Python, it’s common to use the ipykernel package to open a Jupyter
kernel in your IDE like VSCode or Cursor. Alternatively, a lot of users prefer to use Jupyter Lab,
an interactive computing environment for Python. The yFiles Jupyter Graphs widget is designed for these
use cases, allowing users working in Python to visualize Kuzu graphs in their Jupyter notebooks. See
their GitHub page
for a list of supported environments.
Installation
The yFiles Jupyter Graphs widget can be installed using uv or pip:
# Install kuzu as a pre-requisiteuv inituv add kuzu yfiles-jupyter-graphs-for-kuzu# Install kuzu as a pre-requisitepip install kuzu yfiles-jupyter-graphs-for-kuzuCreate a graph
Let’s create a graph of well-known physicists and their relationships. There is one node
table Person, and one relationship table MENTORED, which describes who mentored whom.
Each person has a name and an alias, which is the name they are best known by.
import kuzufrom yfiles_jupyter_graphs_for_kuzu import KuzuGraphWidget# Open a new in-memory databasedb = kuzu.Database(":memory:")conn = kuzu.Connection(db)# Create tablesconn.execute("CREATE NODE TABLE Person(name STRING PRIMARY KEY, alias STRING)")conn.execute("CREATE REL TABLE MENTORED(FROM Person TO Person)")# Insert dataconn.execute(""" MERGE (a:Person {name: "John Strutt", alias: "Lord Rayleigh"}) MERGE (b:Person {name: "Joseph Thomson", alias: "JJ Thomson"}) MERGE (c:Person {name: "Ernest Rutherford", alias: "Ernest Rutherford"}) MERGE (d:Person {name: "Niels Bohr", alias: "Niels Bohr"}) MERGE (e:Person {name: "Christian Christiansen", alias: "Christian Christiansen"}) MERGE (a)-[:MENTORED]->(b) MERGE (b)-[:MENTORED]->(c) MERGE (b)-[:MENTORED]->(d) MERGE (c)-[:MENTORED]->(d) MERGE (d)-[:MENTORED]->(e)""")Display graph with default layout
Once the data is in the graph, you can create a yFiles Jupyter Graphs widget to visualize it.
The show_cypher method takes a Cypher query and displays the result as a graph inside the Jupyter
notebook.
# Create a widget instance using the existing connectiong = KuzuGraphWidget(conn)# Display the entire graphg.show_cypher("MATCH (a)-[b]->(c) RETURN * LIMIT 100")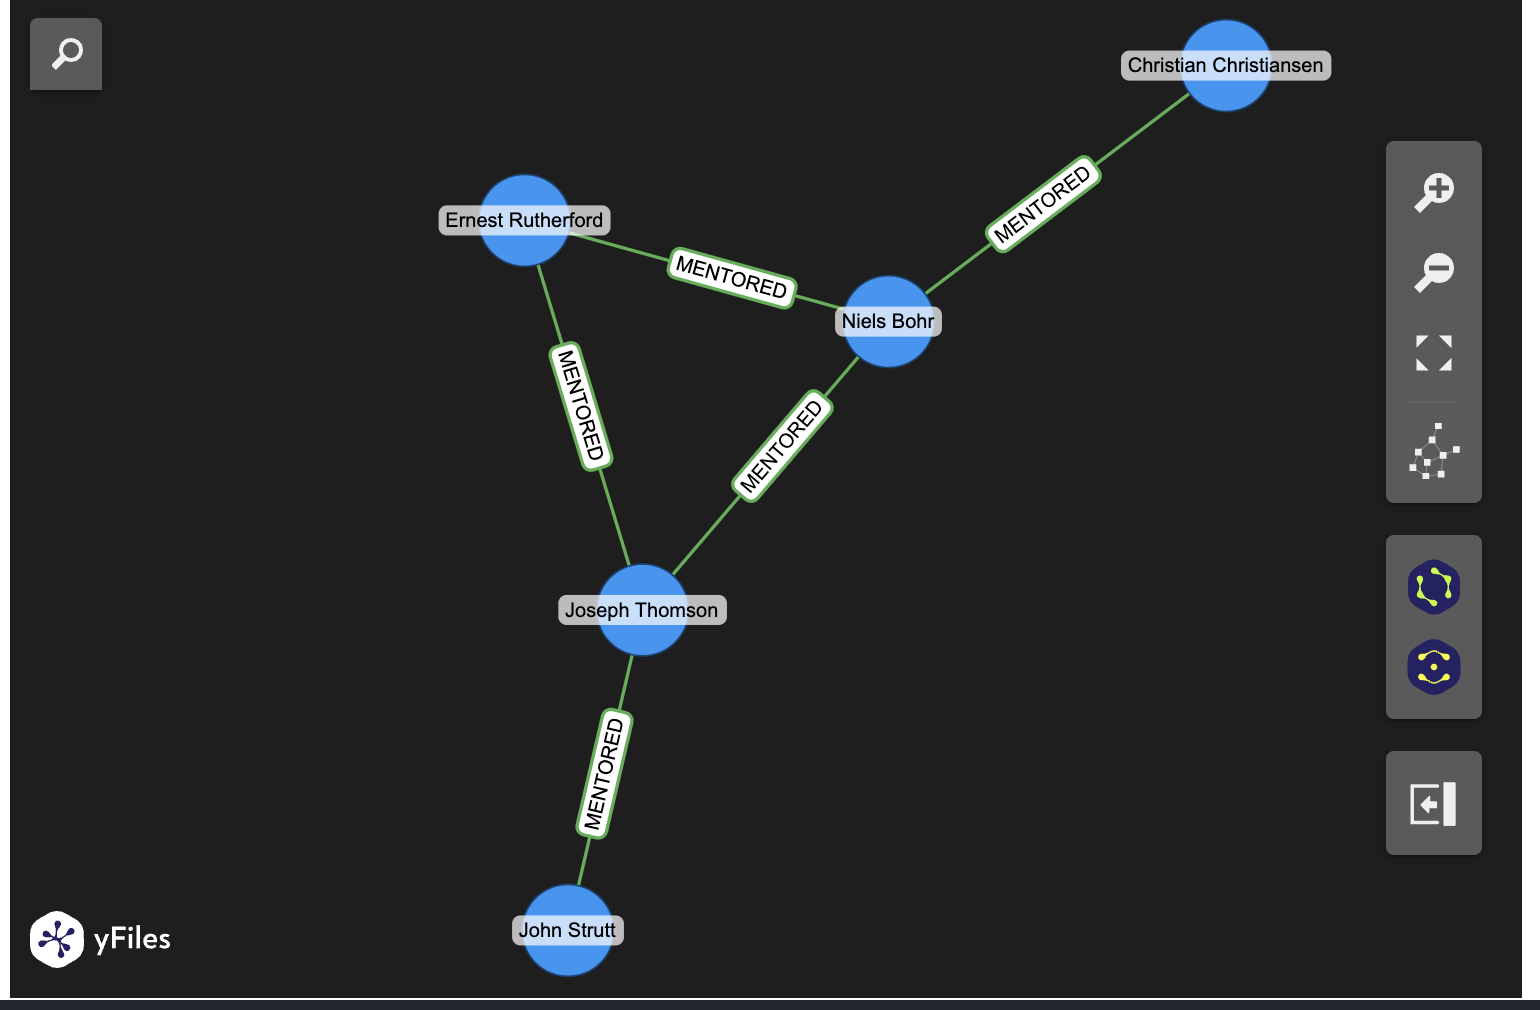
The widget will display the entire graph, with all nodes and relationships in the default layout.
Display graph with custom layouts
The yFiles Jupyter Graphs widget supports a variety of layouts, which can be specified when initializing the widget to always display the graph in a certain way.
In this case, because the relationships result in a tree structure, it can be useful to specify the
tree layout while initializing the widget. The query being run here is asking the question “Who are
the mentors of Christian Christiansen up to 2 degrees?”.
g2 = KuzuGraphWidget(conn, layout="tree")# Match the mentors of Christian Christiansen up to 2 degreesg2.show_cypher("MATCH (a:Person)-[r:MENTORED*1..2]->(b:Person {name: 'Christian Christiansen'}) RETURN *")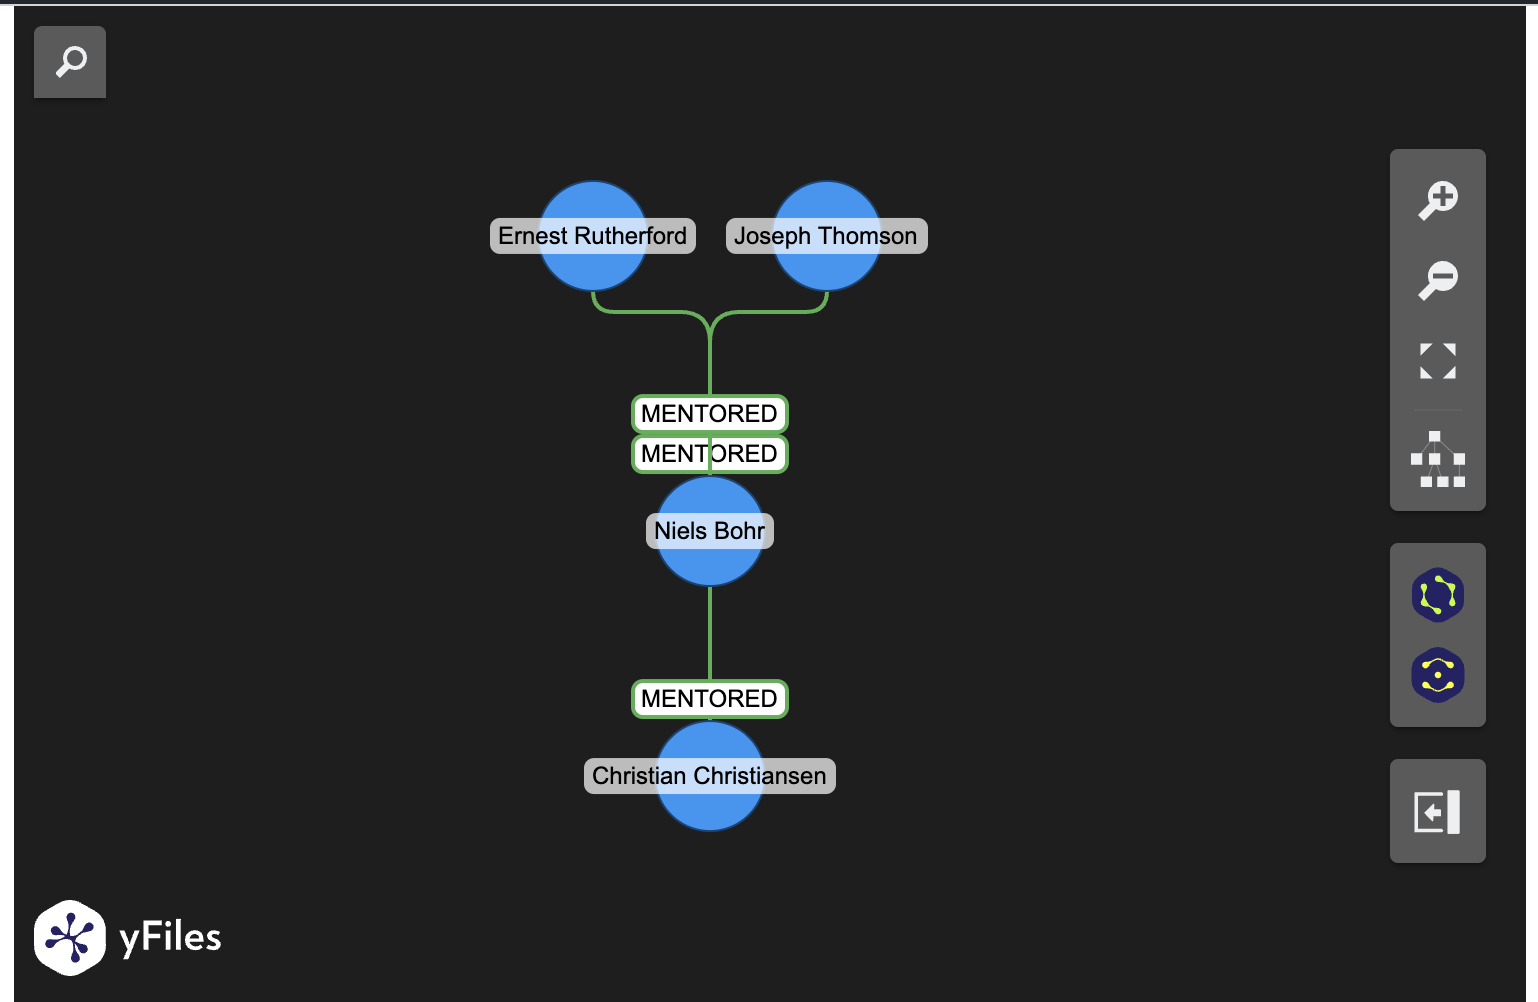
The result is displayed in the tree layout, with the mentors of Christian Christiansen at the root.
Customize node appearance
With the add_node_configuration method, you can customize the appearance of nodes and relationships.
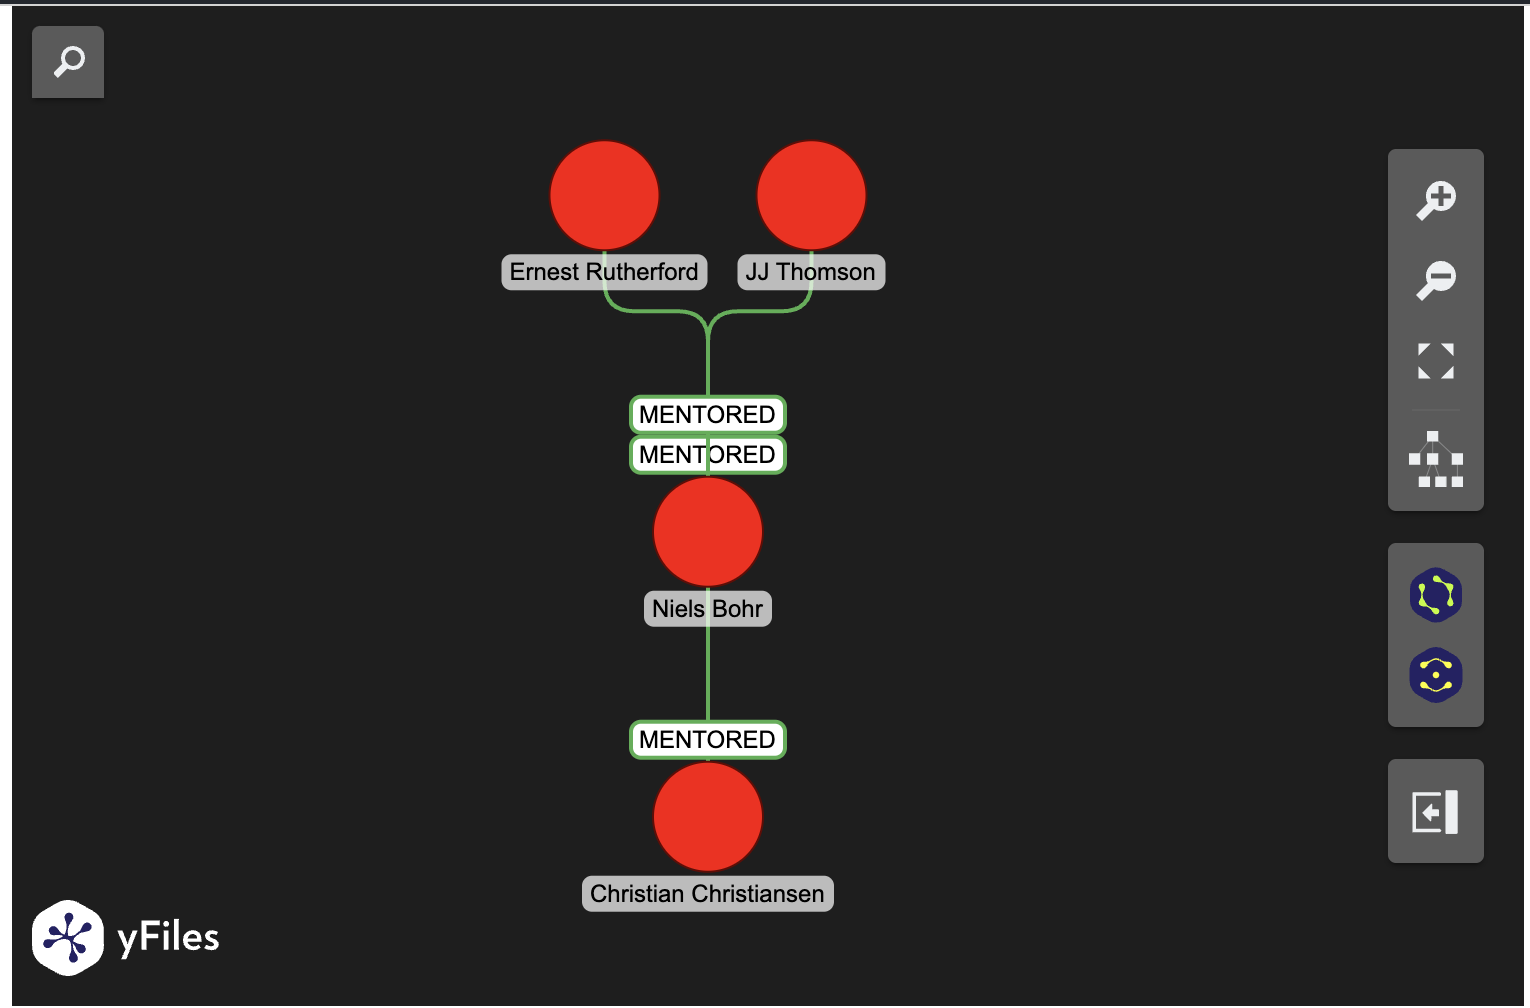
# Custom configuration for nodesg2.add_node_configuration(    "Person",    color="red",   # type: ignore    text= lambda node : {   # type: ignore        "text": node["properties"]["alias"],        "position": "south",    })  #
# Match the mentors of Christian Christiansen up to 2 degreesg2.show_cypher("MATCH (a:Person)-[r:MENTORED*1..2]->(b:Person {name: 'Christian Christiansen'}) RETURN *")
The result is displayed with all nodes coloured red, and the alias of each person displayed at the south of the node.
Interactive layouts
Once the layout is generated, you can also change the layout interactively by clicking on the layout button in the widget and picking from the available layouts. The example below shows the “orthogonal” layout, which is a variation of the “tree” layout that is more compact and enforces a grid structure.
# Match the mentors of Christian Christiansen up to 3 degreesg2.show_cypher("MATCH (a:Person)-[r:MENTORED*1..3]->(b:Person {name: 'Christian Christiansen'}) RETURN *")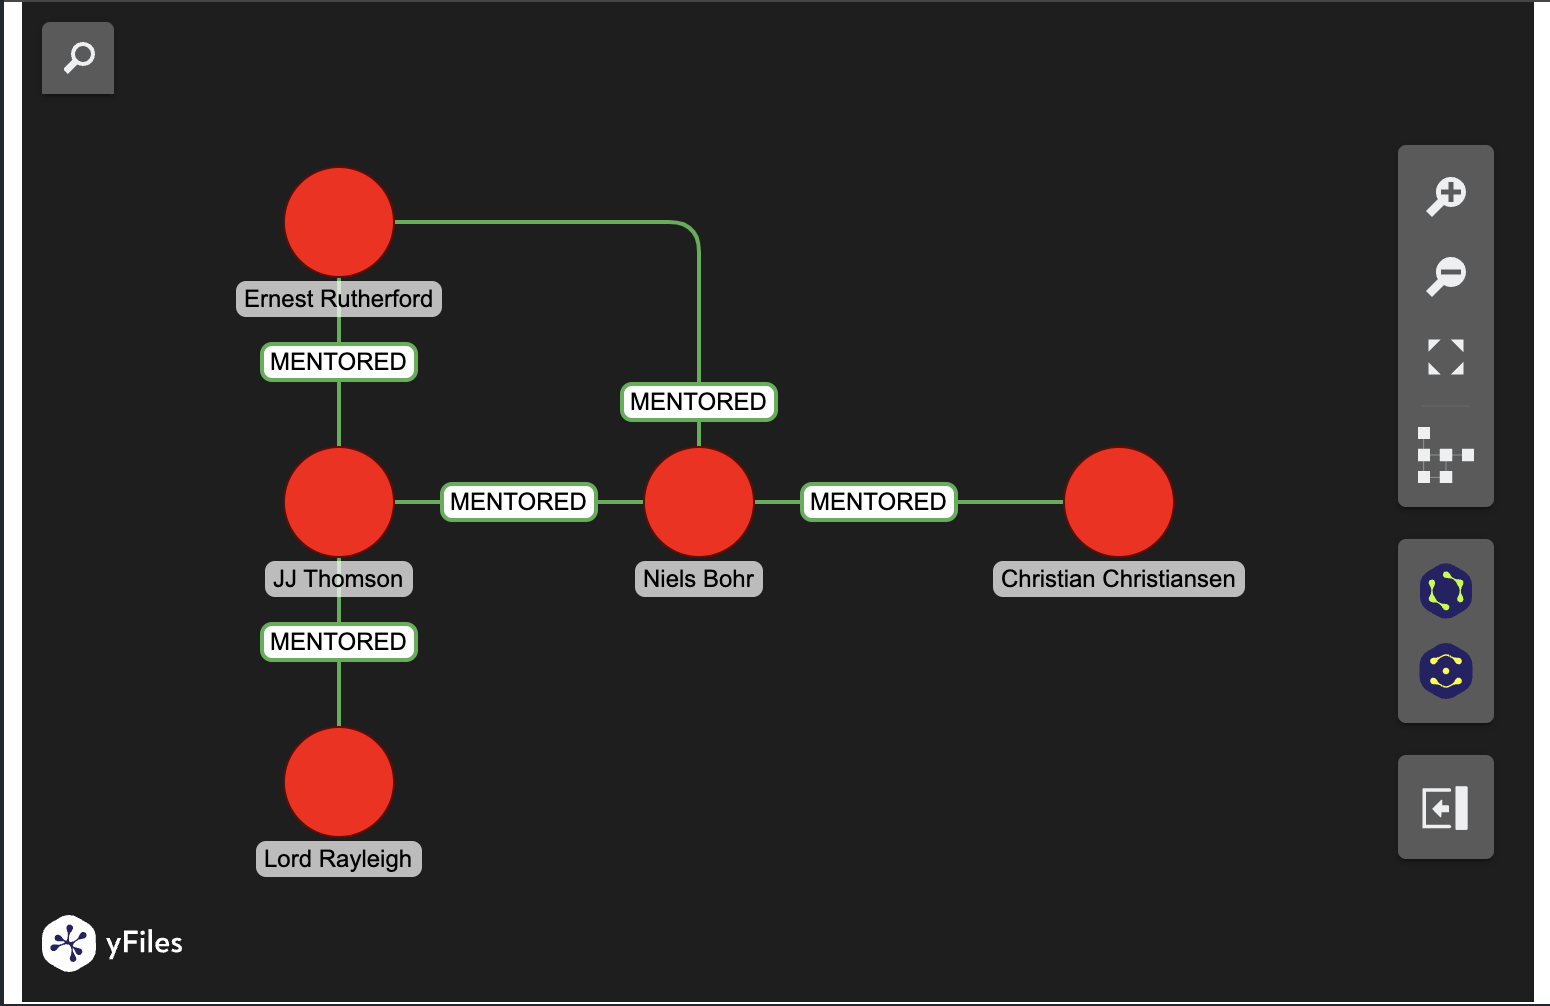
You can experiment with different layouts and customizations to find the best way to visualize your data on the fly!
Directed vs. undirected relationships
Kuzu stores all relationships as directed, but the yFiles Jupyter Graphs widget allows you to visualize them as undirected. The default behaviour in yFiles is to visualize graphs as directed, based on the source and target node IDs in each item of the result set.
To visualize relationships as undirected, you can pass the undirected parameter to the show_cypher method:
g2.show_cypher("MATCH (a:Person)-[r:MENTORED*1..3]->(b:Person {name: 'Christian Christiansen'}) RETURN *", undirected=True)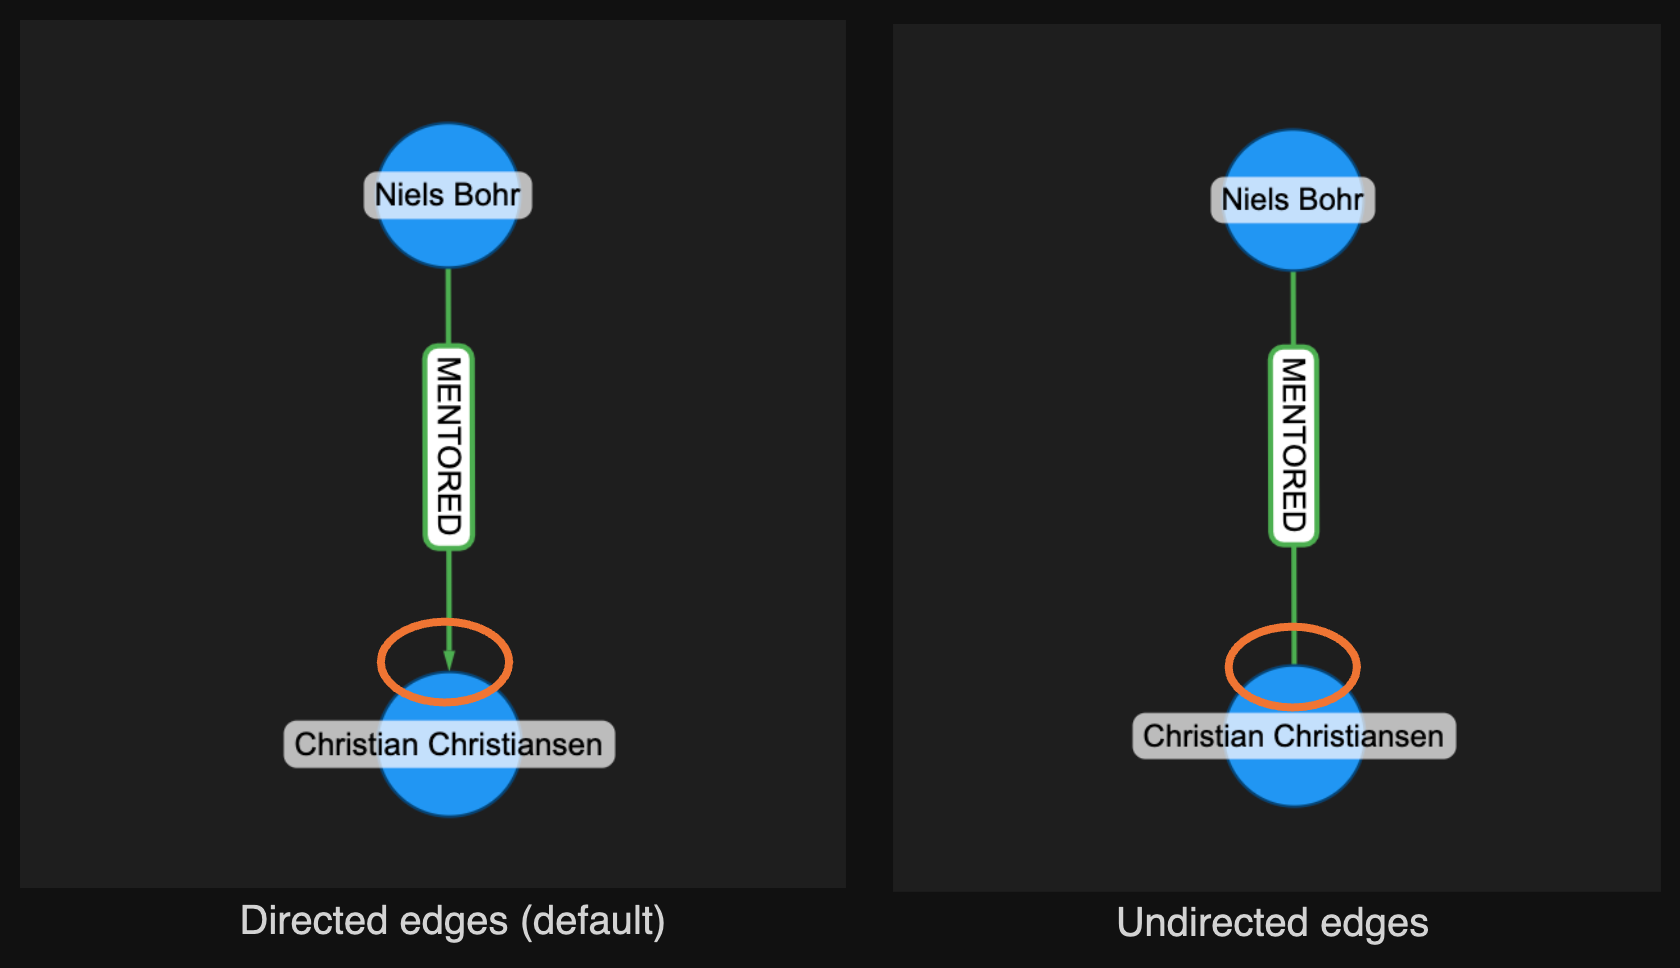
More examples
Visit the yFiles Jupyter Graphs for Kuzu GitHub page to see an example notebook with more examples.